Why Youth Softball Stats Are Less Reliable Than You Think
Small sample sizes, inconsistent scorekeeping, and false precision make youth softball stats far less dependable than they appear
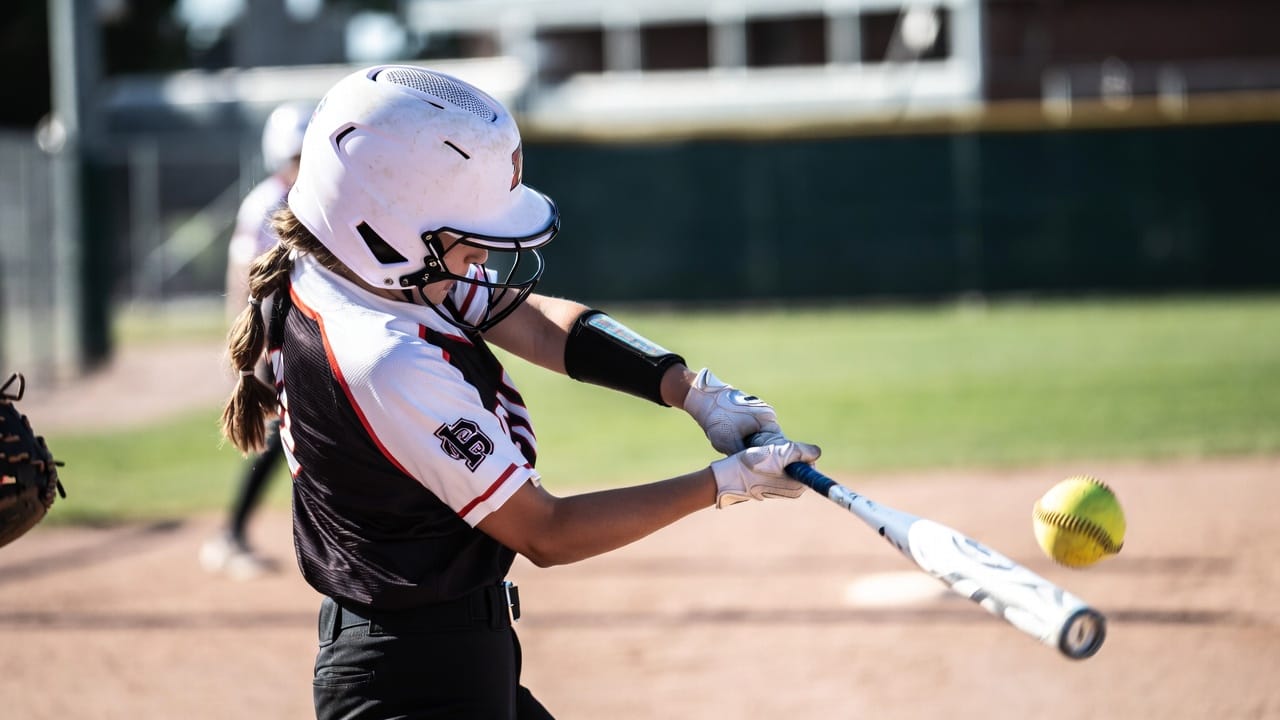
If you’ve spent any time around travel softball, you’ve seen how much attention stats get.
Batting averages are compared. On-base percentages are tracked. Pitching ERAs are debated. Apps like GameChanger make it easy to pull up numbers instantly, and even easier to treat them as objective truth.
But there’s a deeper issue that often gets overlooked.
Before you even start interpreting youth softball stats, you have to ask a more basic question:
How reliable are these numbers in the first place?
At the youth level, stats aren’t just incomplete. They’re often built on small sample sizes, inconsistent scorekeeping, and conditions that vary dramatically from one game to the next. That doesn’t make them useless. But it does make them far less precise, and far more fragile, than they appear.
A player hitting .412 may look meaningfully better than one hitting .368. But over the course of a typical youth season, that difference might come down to two or three plays, or even how a single scorekeeper ruled a borderline hit. The numbers feel exact. The reality behind them often isn’t.
A Simple Example That Isn’t So Simple
Imagine two players:
Player A is hitting .500
Player B is hitting .400
At first glance, the conclusion seems obvious. Player A is the better hitter.
But look a little closer:
Player A has faced mostly weaker pitching in local league play
Player B has played primarily in tournaments against stronger competition
Player A’s team scorekeeper tends to rule borderline plays as hits
Player B’s team leans toward calling those same plays errors
Now, which player is better?
The answer is: you don’t know from those numbers alone.
And that’s the core problem with youth softball stats.
The Two Biggest Issues: Sample Size and Data Quality
1. Small Sample Sizes
In professional baseball or high-level college softball, players may accumulate hundreds of plate appearances. Over time, performance tends to stabilize. At the youth level, that simply isn’t the case.
A player might have:
30 at-bats
45 at-bats
Maybe 60–70 in a full season
At that scale, a few plays can dramatically shift the numbers. A bloop hit or two can raise a batting average by 50 points. A couple of hard-hit balls right at fielders can drop it just as quickly.
What looks like a meaningful difference often isn’t.
2. Inconsistent Scorekeeping
This is the issue that gets talked about less, but may matter even more. Not all stats are created equally because not all scorekeepers are consistent.
Consider just one category: hits vs. errors.
Some teams award hits liberally
Others are much stricter
Some scorekeepers simply don’t know the difference
The result? Two players can make identical contact on identical plays and receive completely different statistical outcomes.
Now multiply that across:
Multiple tournaments
Different organizations
Varying levels of competition
The dataset quickly loses its reliability.
The Illusion of Precision
One of the biggest traps in youth softball stats is how precise the numbers look.
A player hitting .417 appears meaningfully better than one hitting .389. A pitcher with a 2.10 ERA seems clearly more effective than one at 2.85. The numbers create a sense of separation that feels real and measurable.
But in most youth softball environments, that precision is an illusion.
Over the course of a typical season, those differences often come down to a handful of plays. Two extra hits. One hard ground ball ruled an error instead of a hit. A bloop single that falls in versus a line drive caught right at a defender.
In other words, what looks like a meaningful statistical gap may simply reflect a few moments that could have easily gone the other way.
And when you factor in inconsistent scorekeeping, the illusion becomes even stronger. A borderline play might be scored differently depending on who is keeping the book, which can quietly shift a player’s numbers without changing their actual performance.
The result is a kind of false confidence. The numbers feel exact, but they are often built on inputs that are anything but. That doesn’t mean stats should be ignored. But it does mean that small numerical differences—especially in limited samples—should be treated with caution, not certainty.
The Problem With Overemphasizing Any Single Stat
Because of these limitations, focusing too heavily on one stat—especially in isolation—can be misleading.
Batting average is the most common example. It tells you something, but not nearly as much as people assume.
A high batting average might reflect:
Weak competition
Favorable scorekeeping
A small number of at-bats
Or a very aggressive approach that doesn’t translate well at higher levels
Similarly, a lower average might hide:
Strong contact against good pitching
A disciplined approach at the plate
Or simply a stretch of bad luck
The same issues apply to pitching stats like ERA, which are heavily influenced by:
Defensive quality
Errors (or lack thereof in the scorebook)
Strength of opposing lineups
None of this means the stats are useless. It means they are incomplete.
Context Matters More Than the Number
At the youth level, context is everything. When you look at a stat line, you should be asking:
Who was the competition?
How many opportunities are we talking about?
How are stats being recorded?
What type of player is this? (aggressive vs. selective, contact vs. power)
Even style of play matters. For example:
A player who swings at everything may have a higher average in weaker competition
A more selective hitter may walk more but have fewer “official” hits
Without context, the numbers don’t tell the full story.

Why Combining Information Works Better
If there is one general principle that holds up, it’s this:
A combination of indicators is more useful than any single stat.
Looking at multiple data points—even imperfect ones—can give you better directional insight.
For example, instead of focusing only on batting average, you might consider:
Frequency of solid contact
Walk tendencies
Strikeout patterns
Performance against stronger pitching
Even then, the numbers should support, not replace, what you actually see on the field.
The Reality: Stats Are a Tool, Not a Verdict
There’s a well-known quote often attributed to Mark Twain:
“There are three kinds of lies: lies, damned lies, and statistics.”
That doesn’t mean stats are inherently deceptive. But it does mean they can be misleading when taken at face value, especially in environments where:
Samples are small
Data collection is inconsistent
Context varies dramatically
That describes youth softball perfectly.
How to Actually Use Stats the Right Way
For parents, players, and coaches, the goal shouldn’t be to ignore stats. You just need to use them more thoughtfully.
A few guiding principles:
Treat stats as directional, not definitive
They can point you toward trends, but rarely give final answers.Look for patterns, not small differences
A 50-point difference in batting average may not mean much in a small sample.Always consider context
Competition level and scorekeeping matter more than most people realize.Use stats alongside observation
What you see in games and practices should carry equal—or greater—weight.Expect different interpretations
Two knowledgeable people can look at the same numbers and reach different conclusions.
Final Thought
Stats feel objective. That’s part of their appeal. But in youth softball, they are far from perfect.
The players who develop the most—and the families and coaches who make the best decisions—are usually the ones who understand this:
Numbers can inform the conversation. They shouldn’t end it.
The News Source 2.3 Million Americans Trust More Than CNN

Tired of spin? The Flyover delivers fast, fact-focused news across politics, business, sports, and more — free every morning. No agenda. No paywall. Join 2.3 million readers who trust us to start their day right.